Basic physics and public data. The results are estimates: they show orders of magnitude and cannot reconstruct a crash.
The energy a vehicle has because it is moving. To stop it, all of it must be dissipated, by the brakes or by the crash. What people often call the “force” of a moving vehicle is this energy.
E = ½ · m · v²
- m: vehicle mass in running order plus 75 kg for each person besides the driver. EU mass in running order already includes a 75 kg driver.
- Average car: 1,559 kg, the mean of new cars registered in the EU in 2024 (EEA provisional data). Van: 1,896 kg, the mean of new vans registered in 2023. City car, SUV, motorcycle, bicycle, e-scooter and bus: typical values chosen by us.
- Bus: at most 100 people on board, so the total mass stays below the permitted 19,500 kg.
- v in m/s: km/h divided by 3.6. Twice the speed gives four times the energy.
Sources
- Regulation (EU) No 1230/2012, Article 2 (definitions), European Commission (text read on legislation.gov.uk), 2012
- Regulation (EU) 2019/631, Article 3(1)(g), European Parliament and Council (text read on legislation.gov.uk), 2019
- Implementing Regulation (EU) 2020/683, Annex I, point 2.6, note 30, European Commission (text read on legislation.gov.uk), 2020
- Average CO2 emissions from new cars and new vans (provisional 2024 data), European Environment Agency, 2025
- New data: CO2 emissions of new cars and vans (provisional 2023 data), European Environment Agency, 2024
- Citaro: technical data, Daimler Buses (Mercedes-Benz), 2026
The height you would have to fall from to hit the ground at the same speed.
h = v² / (2 · g)
- g = 9.80665 m/s², standard gravity.
- For storeys we count 3 m per storey: a convention.
Sources
The distance travelled between seeing the obstacle and the brakes starting to work.
s_r = v · t_r
- t_r = 1.5 s by default; 1 s or 2.5 s can also be chosen. It is the time that matches the Queensland Government table we also take the decelerations from: 21 m of reaction distance at 50 km/h.
- Italian road design rules use longer times: 2.8 − 0.01 · V seconds, that is 2.3 s at 50 km/h.
- 1 s holds for a driver who is already alert and ready to brake; faced with something unexpected, times around 1.5 s are measured.
Sources
The distance travelled from the start of braking to standstill.
s_f = v² / (2 · a)
- a: mean deceleration, constant. Car and van: 6.9 m/s² on dry and 4.8 m/s² on wet roads, derived from the braking distances published by the Queensland Government for an average family car.
- The legal minimum for a car is 6.43 m/s². A recent car with ABS, braking fully on dry asphalt, does better: in tests with 20 cars from 65 km/h the mean decelerations range from 8.5 to 10.6 m/s².
- For wet roads, Italian road rules use more cautious design values, from 4.4 to 3.4 m/s² between 25 and 60 km/h.
- Motorcycle 6.43 m/s², the legal minimum with both controls. Bus 5.0 m/s², the legal minimum. Bicycle 3.5 m/s² and e-scooter 3.0 m/s²: our assumptions. On wet roads we reduce their deceleration to about 70% of the dry value, as for the car.
Sources
- Stopping distances on wet and dry roads, Queensland Government, Department of Transport and Main Roads, 2016
- UN Regulation No. 13-H (braking of passenger cars), Annex 3, para. 2.1.1, UNECE (copy from the Japanese Ministry of Land, Infrastructure, Transport and Tourism), 2015
- Decelerations for Vehicles with Anti-lock Brake Systems (ABS) on Dry Asphalt and Concrete Road Surfaces, Miller I., King D., Wilkinson C., Siegmund G.P., SAE Technical Paper 2023-01-0616, 2023
- Ministerial Decree of 5 November 2001, no. 6792, "Functional and geometric standards for road construction", section 5.1.2 (in Italian), Italian Ministry of Infrastructure and Transport (copy read on certifico.com), 2001
- UN Regulation No. 78 (braking of category L vehicles), Annex 3, paras. 3.3 and 4.3, UNECE (copy from the Japanese Ministry of Land, Infrastructure, Transport and Tourism), 2015
- UN Regulation No. 13 (braking of heavy vehicles), Annex 4, UNECE (copy from the Japanese Ministry of Land, Infrastructure, Transport and Tourism), 2016
Reaction distance plus braking distance. If the obstacle is farther away, you stop before it.
s = s_r + s_f = v · t_r + v² / (2 · a)
- The obstacle distance is the distance at which you see it.
The speed you still have when you reach the obstacle, after braking over the available distance.
v_i = √(v² − 2 · a · (D − v · t_r))
- D: obstacle distance. If D is less than or equal to the reaction distance, the impact happens before braking and v_i = v.
How much the vehicle’s speed changes in the crash, and how quickly.
a_m = Δv / Δt
- Against the wall Δv = v_i: the vehicle stops. Against the stationary car Δv comes from momentum, see below.
- Δt = 0.1 s. In rigid barrier tests the crash lasts between 91 and 113 milliseconds depending on the vehicle type. The tests were run between 40 and 56 km/h, and in that range the duration does not change with speed. Using it outside that range is our assumption.
- Above a 70 km/h change in speed the calculated crush reaches a metre and more, beyond what the front of a car can give: there we show no deceleration, forces or crush.
- Cars and vans only. For bicycles, e-scooters, motorcycles and buses we have no reliable data and compute no forces.
Sources
- Homogenization of Vehicle Fleet Frontal Crash Pulses from 2000–2010, Locey C.M. et al., Annals of Advances in Automotive Medicine 56: 299–311, 2012
The mean force that stops the vehicle during the crash.
F = m · a_m
- For a 75 kg person wearing a seat belt: F = 75 kg · a_m. We also show it as an equivalent weight, F / g: like holding up that many kilograms for a tenth of a second.
- We assume the person slows down with the car, over the same time. Belts with some slack and load limiters distribute the real force differently.
- It is a mean: the real peak is higher, usually more than double.
Sources
- Regulation (EU) No 1230/2012, Article 2 (definitions), European Commission (text read on legislation.gov.uk), 2012
- Homogenization of Vehicle Fleet Frontal Crash Pulses from 2000–2010, Locey C.M. et al., Annals of Advances in Automotive Medicine 56: 299–311, 2012
How much the front end shortens during the crash, if the deceleration were constant. Against the stationary car it is the total shortening of the two vehicles: half each in the scene.
d = v_i · Δt / 2
- d is an overestimate. The measured duration runs until the deceleration falls to 5% of its peak and includes the rebound: the phase in which the front is crushed lasts less than 0.1 s, and the real crush is smaller.
Sources
- Homogenization of Vehicle Fleet Frontal Crash Pulses from 2000–2010, Locey C.M. et al., Annals of Advances in Automotive Medicine 56: 299–311, 2012
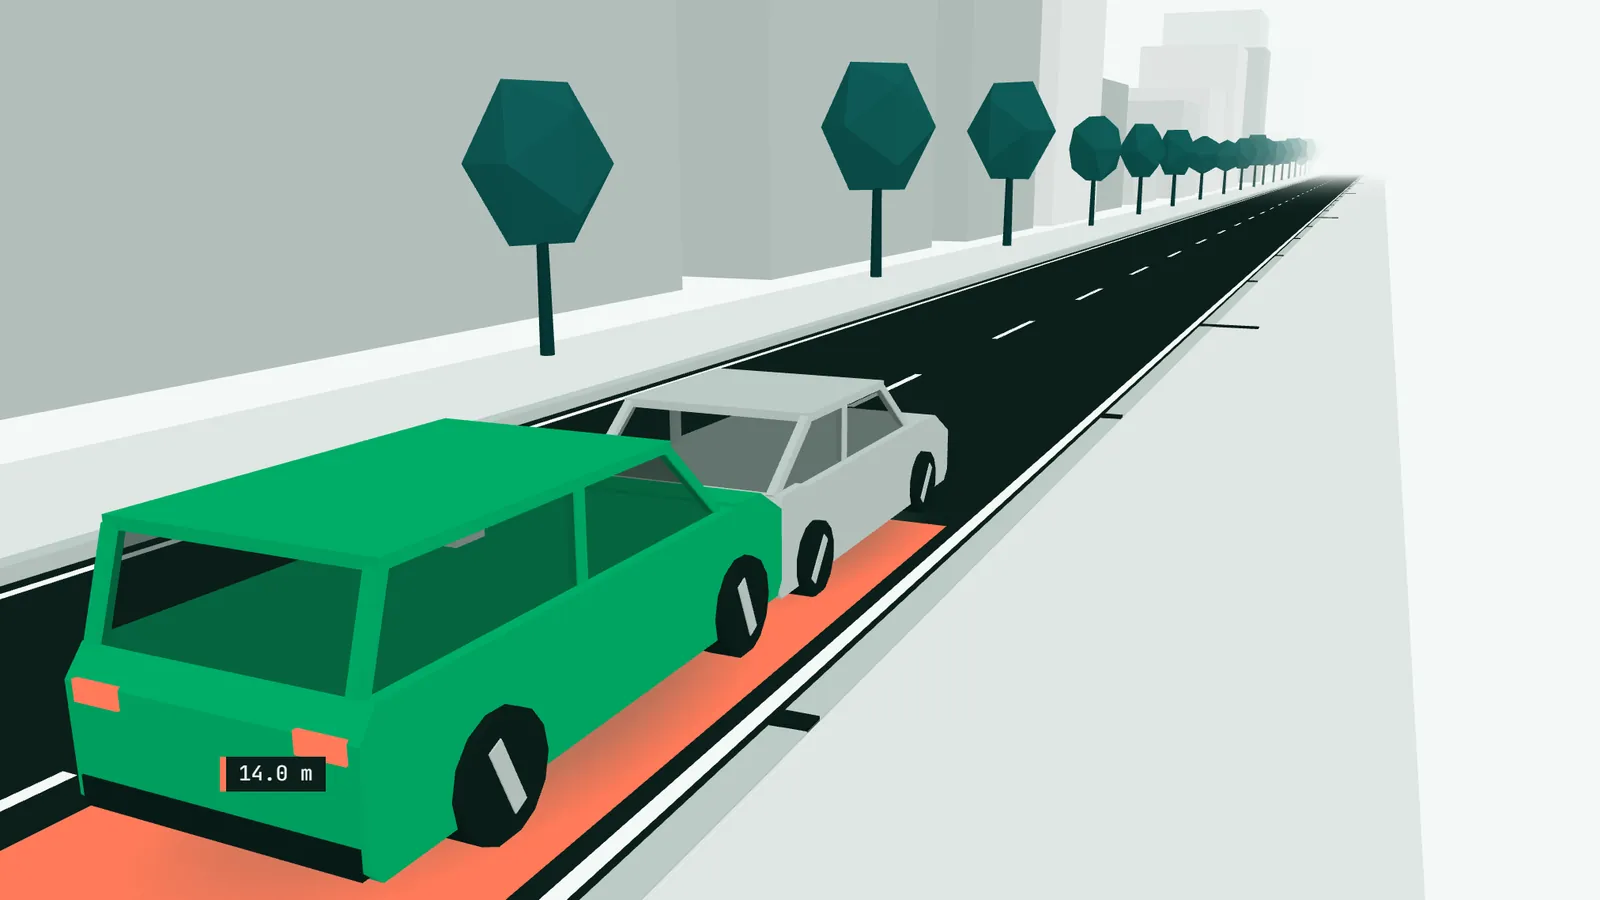
The two vehicles stay together and move on at a common speed. Momentum is conserved; part of the energy turns into deformation.
v_f = m₁ · v_i / (m₁ + m₂); Δv₁ = v_i − v_f; Δv₂ = v_f; E_d = ½ · m₁ · m₂ / (m₁ + m₂) · v_i²
- m₂ = 1,559 kg, the mean of new cars registered in the EU in 2024. With equal masses each changes speed by half of v_i and half of the energy is dissipated.
- The stationary car is free to move: its brakes play no part.
- The lighter vehicle has the larger change of speed.
Sources
The probability that a pedestrian struck head-on by a car, an SUV or a van is very severely injured or dies, by impact speed.
Linear interpolation between the points of the reference curve
- Very severe injury or death (AIS 4 or more, death included): 10% at 26 km/h, 25% at 37, 50% at 50, 75% at 63, 90% at 74 km/h.
- Death: 10% at 37 km/h, 25% at 51, 50% at 68, 75% at 80, 90% at 93 km/h.
- Outside these ranges we only show “less than 10%” or “more than 90%”.
- The data describe pedestrians aged 15 and over in the United States, in crashes of 1994–1998, struck by cars and by light trucks (pickups, vans and SUVs) counted together. Speeds converted from mph.
- We use the same curve for city cars, cars, SUVs and vans, although the study finds light trucks more dangerous than cars at equal speed. The top of the curve rests on few cases.
- A 2019 review of 20 studies gives higher risks of death at medium and high speeds: 50% at 59 km/h, 90% at 80 km/h. The curve we show is the less alarming one.
- For older people the risk is higher. The curve does not apply to children under 15.
- It does not apply to bicycles, e-scooters, motorcycles and buses: for them we show no percentages.
Sources
- Impact Speed and a Pedestrian's Risk of Severe Injury or Death, Tefft B.C., AAA Foundation for Traffic Safety (later in Accident Analysis & Prevention 50, 2013), 2011
- The relationship between impact speed and the probability of pedestrian fatality during a vehicle-pedestrian crash: a systematic review and meta-analysis, Hussain Q., Feng H., Grzebieta R., Brijs T., Olivier J., Accident Analysis & Prevention 129: 241–249, 2019
They have no structure that absorbs the crash: the rider carries on at the impact speed. We show the rider’s kinetic energy and equivalent fall height.
E = ½ · 75 kg · v_i²; h = v_i² / (2 · g)
- 75 kg per person, a convention.
Sources
- Regulation (EU) No 1230/2012, Article 2 (definitions), European Commission (text read on legislation.gov.uk), 2012
We give no verdict on vehicle damage. We compare the change of speed with that of known tests, at equal mass.
energy ratio = (Δv / Δv_test)²
- 15 km/h: insurers’ test (RCAR) on damage and repairability. It is an offset impact: the vehicle covers 40% of the barrier, which is angled at 10°. Equal energy does not mean equal damage.
- 50 km/h: UN R137 type-approval test, against a full-width rigid barrier, with the vehicle at 50 km/h on impact.
- 56 km/h: US NCAP rigid-wall test at 56 km/h, full width. The data on crash duration come from tests like this one.
Sources
- RCAR Low-speed structural crash test protocol, Issue 2.5, Research Council for Automobile Repairs (RCAR), 2024
- UN Regulation No. 137 (frontal collision with focus on the restraint system), paras. 5.2.1.1 and 6.1, Annex 3 para. 1.4, United Nations, E/ECE/324/Rev.2/Add.136 (documentation text), 2016
- New Car Assessment Program (NCAP) Frontal Barrier Impact Test, 2025 Nissan Murano, Final Report NCAP-TRC-25-002, NHTSA (test run by Transportation Research Center Inc.), 2025
- Homogenization of Vehicle Fleet Frontal Crash Pulses from 2000–2010, Locey C.M. et al., Annals of Advances in Automotive Medicine 56: 299–311, 2012
At the point where the same vehicle at 30 km/h would have stopped, we calculate how fast you would still be going at the chosen speed.
v_res = speed at distance s(30 km/h), with the impact speed formula
- Same vehicle, road surface and reaction time.
- If at that point you are still within the reaction time, you have not started braking and are still at the chosen speed.
The model leaves out: ABS and the state of tyres and brakes, slope, bends, wind, load, distraction or fatigue beyond the chosen reaction time.
Braking reaches full deceleration at once: the time it takes for the brake force to build up is not in the calculation.
During the crash we assume constant deceleration. Real crash pulses have peaks higher than the mean.
The crash duration is measured only between 40 and 56 km/h.
The crash is always head-on and full-width. Angle, partial overlap and bumper height change the outcome a lot.
The stationary car is free to move, with its brakes off.
The wet-to-dry ratio and the crash duration are measured for cars; for the other vehicles we use them without data.
For people on board we show mean physical quantities only. Seat belts, airbags, seats and body build are not in the calculation, and we give no risk percentages for occupants.
The shape of the front, of SUVs and vans for example, changes the risk for the pedestrian. The pedestrian data are from the 1990s.
Masses and decelerations of bicycle, e-scooter, motorcycle, city car, SUV and bus are typical values chosen by us: the panel flags each one.